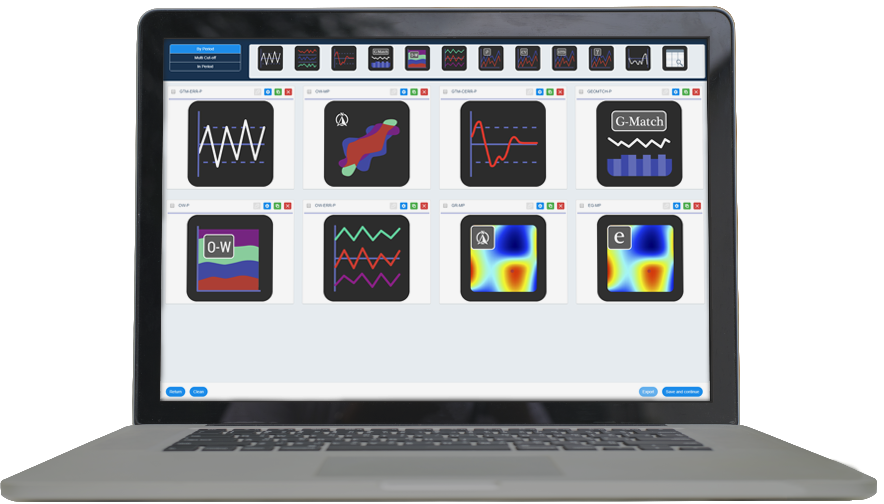
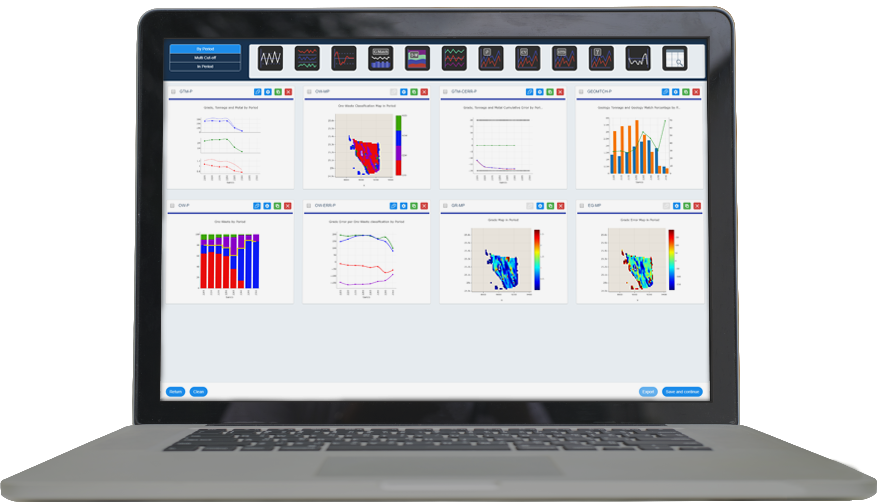
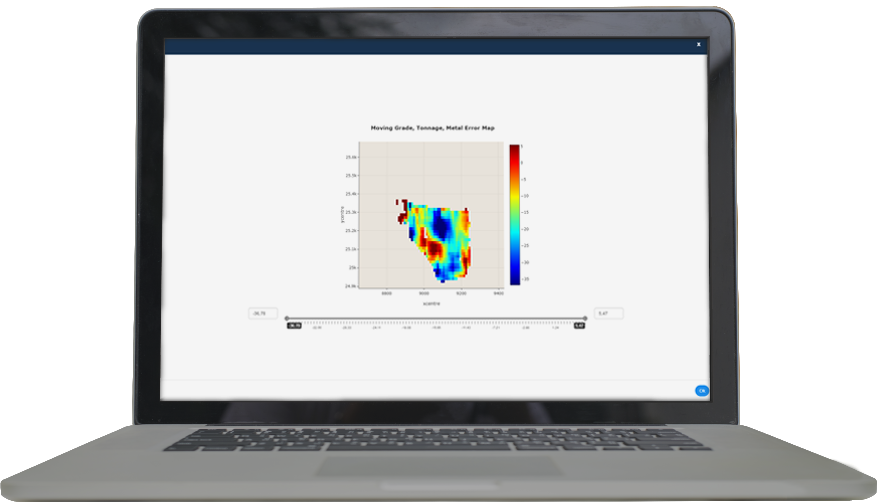
Conciliatron is a tool to perform mining conciliation between two block models. It quantifies the diferences and helps to identify the causes of the errors through all the graphics available to generate.
About Conciliatron
Standarization
Conciliatron facilitates the standardization of the conciliation process, improving the consistency of the results obtained among different people.
Intuitive Design
Conciliatron has been designed under the most intuitive interface for the users, giving them a better experience to make conciliations.
Graphs Dashboard
Conciliatron integrates a dashboard that allows the construction of multiple graphics based on the loaded data.
Automation
Much of the process is automated. No time is lost in reviewing, filtering, grouping and selecting data to obtains results.
Interactive Analysis
The Conciliatron’s Dashboard allows you to generate a wide range of graphics that will help on your analisys. You can run multiple graphics at the same time and visualize each of them without closing (and re-running) the others.
How It is Done
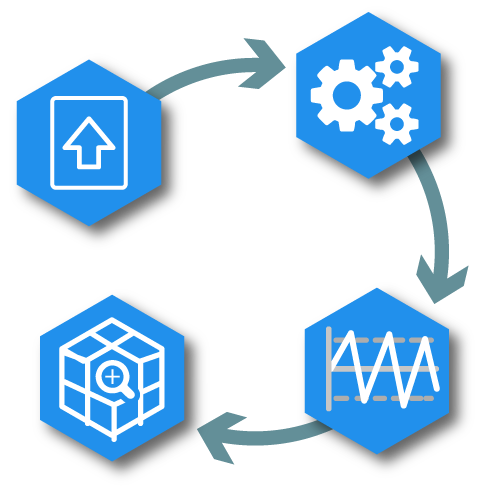
Conciliatron is composed of four macro stages where variables and parameters can be easily adjusted, in order to obtain reports with a customizable number of charts. The generated results can be viewed in the Conciliatron’s interface or be automatically exported to an MS Word® document, PDF file, or MS PowerPoint® presentation.
Stages
Data Load

The block models are read in the Data Load stage. Conciliatron will automatically identify the type of data: categorical, continuous or other type.
Setup
In Setup stage you can group data and create filters, in order to only use the information that is really necessary in the conciliation.
Conciliation

In Conciliation stage you can choose the parameters to perform calculations. They compare the information on the loaded models in order to detect errors.
Analytics

In Analytics stage you can also generate graphics, but these show the calculations based on the information of the models and data from drillholes and blastholes.
